AlwaysOn for High-Availability in SQL Server

It’s very much the case that many organisations rely on a single SQL Server instance to host mission critical ERP, CRM, finance and stock control systems. In the event of a serious issue with your SQL Server instance your organisation will face a system down incident potentially on a mission critical production system.

In SQL Server there are a number of options for disaster recovery and high availability should the worst happen. AlwaysOn is a term used by Microsoft to refer to a number of options for deploying a highly available SQL Server solutions resilient to single points of failure.

You should check with application vendor(s) to confirm support of AlwaysOn technologies. This isn’t just a technological question but also competency from their implementation and support teams too. If you are in the process of or considering a fresh deployment of an application – for example if you are upgrading to the latest version alongside new infrastructure – you should definitely consider including AlwaysOn as part of the solution requirements.

Prior to the introduction of AlwaysOn DBAs would consider using Log Shipping and Database Mirroring however these have now been deprecated in favour of AlwaysOn. If you are using Log Shipping and/or Mirroring for a current deployment use AlwaysOn for any future deployments.

Broadly speaking there are two AlwaysOn methods by which high-availability can be implemented. Both technologies rely on Windows Server Failover Clustering feature to be configured. AlwaysOn options are:

AlwaysOn Availability Groups (AG) provide database level failover and secondary reads for availability databases that are members of an availability group.

If you are using SQL Server Standard Edition the AlwaysOn feature is known as Basic Availability Groups (BAG) and will be limited to two members of which the secondary is read-only.

AlwaysOn Failover Clustering Instances (FCI) as the name implies provides instance level redundancy via active or passive nodes and as such relies on using a shared storage medium such as a shared disk or SAN.

There are advantages and disadvantages to both AlwaysOn methods. Ongoing maintenance from a DBA is necessary to manage the deployment and monitor performance.

Conclusion

In this post we’ve discussed why your organisation should consider adding high-availability options into your Microsoft SQL Server based solution and briefly mentioned the two key methods of achieving such resilience.

If you organisation needs support for AlwaysOn technologies for SQL Server or disaster recovery following an incident Digital Incite and Matter Ltd are here to help you. Please get in touch with us today to discuss your requirements.

Crash Course: Data Masking in SQL Server

In SQL Server there are a number of different features that can be used to help meet data protection policies and requirements within an organisation. Usually features such as Transparent Data Encryption (TDE) are widely employed to secure data but this doesn’t necessarily protect against accidental disclosure from persons and applications that might have a user within the database. One such feature that I’ve recently been working with is Dynamic Data Masking or DDM.

What is Dynamic Data Masking (DDM) and Why Should I Use It?

Dynamic Data Masking (DDM) was introduced in SQL Server 2016 (also in Azure SQL Database) and is a method to mask sensitive data from disclosure to non-privileged users. A masking function is applied to the data at column level using a DDL (Data Definition Language) statement.

This can be useful to allow a user the ability to select the row from the table in order to be able to design a query or report but then hand the responsibility for running the object back to a privileged user. This way the user without the necessary authorisation within the organisation never sees the sensitive data by accident. Think contractors and consultants.

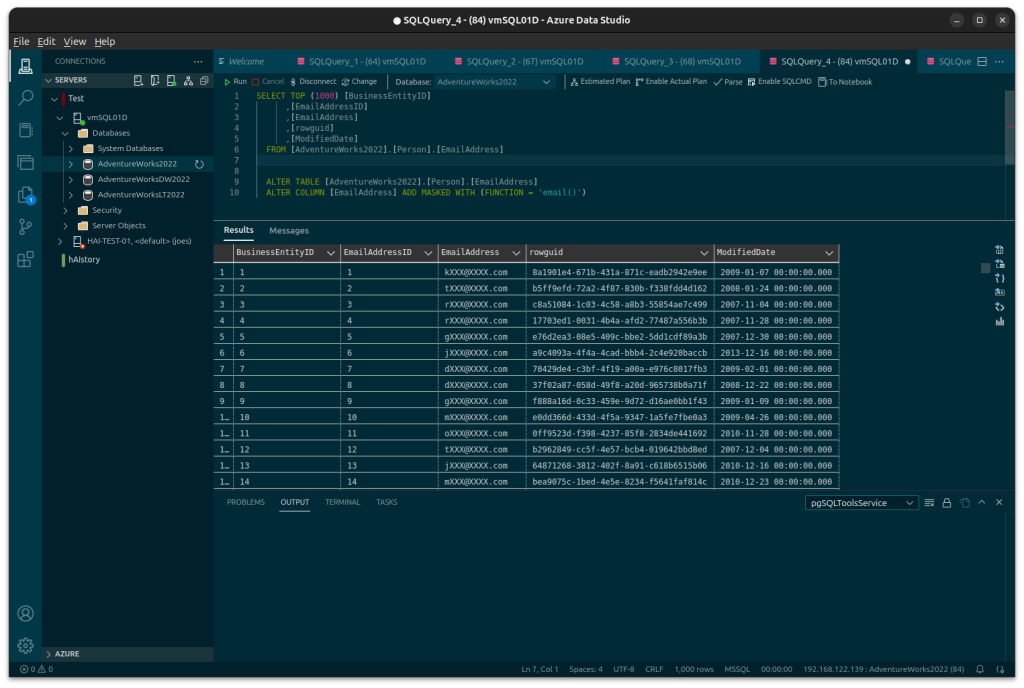
DDM is applied to the table schema per column. In this example I apply to an existing AdventureWorks2022 test database using the email function.

USE [AdventureWorks2022]
ALTER TABLE [Person].[EmailAddress]
ALTER COLUMN [EmailAddress] ADD MASKED WITH (FUNCTION = 'email()')

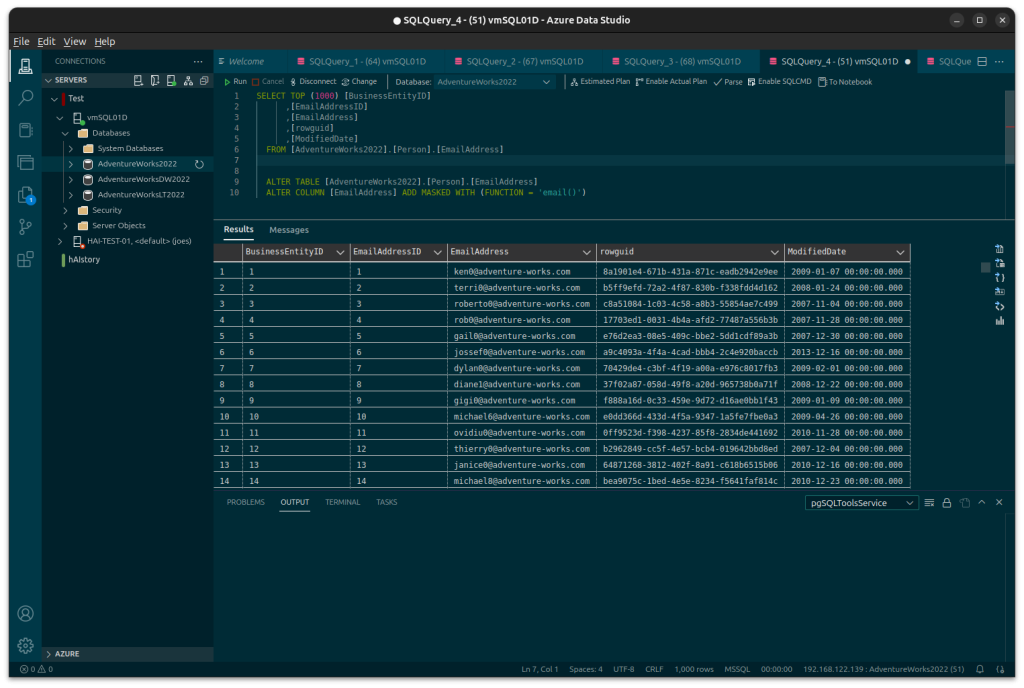
Under normal circumstances a user would be able to select out the table and see the complete email address:

Azure Data Studio with email unmasked.

As a user without the UNMASK privilege they will see:

Azure Data Studio with email masked.

In order for a user in a database to be able to select the unmasked data from the table they must be granted the UNMASK privilege.

There are other types of function available to use and even the ability to implement custom masks as per requirements.

  • Default – full data masking.
  • Email – Masks the email after the first letter up to the @ and then the domain up to the suffix.
  • Random – can be used on numeric types to mask the original value with a random value.
  • Custom String – creates a custom masking method which exposes the first and last letter only with a padding string in the middle.
  • Datetime (SQL Server 2022 and above) – allows masking segments of a date and/or time.

There are some technical limitations to DDM such as not being able to apply masks to encrypted columns or computed columns. It also doesn’t fully secure data against malicious users who may find other way around the mask.

Conclusion

Dynamic Data Masking or DDM is just one of a number of features available in Microsoft SQL Server that can be used to protect data from leak or exposure. As SQL Server consultants Digital Incite and Matter Ltd can assist with implementing such features. For assistance with DDM or anything SQL Server related get in touch with us today for an initial consultation.

Tips for Deploying Secure Instances of Microsoft SQL Server

Your organisation’s data is a critical asset that needs the upmost care and attention to securely store & manage. For organisations with a Microsoft technology stack – in terms of infrastructure, applications and internal skills – Microsoft SQL Server is a RDBMS of choice designed with security in mind to meet such requirements.

When you deploy an SQL Server instance it’s important to work with your internal IT teams to make your installation secure right from the point of installation. In this blog post I’m going to discuss 5 points I recommend to ensure a secure basis for any SQL Server installation.

Tip 1: Deploy on Windows Server Core. If you can.

Most of us are familiar with the Windows GUI but for Windows Server it’s possible to deploy a reduced install of the OS known as Windows Server Core. This feature was first introduced with Windows Server 2008. This is achieved via a selection of the edition when the OS is first installed and is actually the default choice.

Installing Windows Server as Server Core affords a number of advantages. The principle benefit is that as the install is reduced in terms of components and features compared to a GUI install the attack surface is much reduced. There is also a slight performance advantage in terms of CPU and memory saved by the reduced overhead of the install.

Note that a drawback of a Server Core install is that some features such as SQL Server Reporting Services need the GUI install. If you choose to deploy an application on the same server (typically to save costs if the application only serves a few users) the vendor may also require a full GUI install. You also need to be completely proficient in using CLI based tools or remote management as the usual GUI tools aren’t present.

Tip 2: Apply the Latest Cumulative Update or Security Update

SQL Server generally has a good record when it comes to security vulnerabilities. That being said there has been a number of security issues identified and fixed in SQL Server. Patching just like any other program in use is a necessity.

In SQL Server you have two options regarding your update track. Highly recommended is the apply the latest Cumulative Update (CU). Not only will the instance receive the most up-to-date security fixes but also fixes to other areas of the database server.

Alternatively if your SQL Server instance hasn’t been patched using a CU then it would still be considered “GDR” or General Distribution Release”. These releases will still receive updates without applying a CU typically via Windows Update.

You should also check that on both clients and server that the various SQL Server connectivity drivers are patched up to date if they are mandated by any client applications.

Tip 2: Enable TLS by Applying a Certificate

TLS or Transport Layer Security is an encryption protocol that protects data sent and received between SQL Server and the client. Under principles of Zero Trust you should still take steps to encrypt data in transit even if you own the network SQL Server is running on.

A certificate should be procured either via an internal Certificate Authority (CA) server or via a recognised broker. For testing purposes a self-signed certificate can be used by is not recommended. This then secures application traffic against eavesdropping.

Note that you should never allow connectivity to SQL Server over the internet.

Tip 4: Use Windows Authentication Where Possible

SQL Server can be run in either Windows or Mixed authentication modes. There are a number of drawbacks to using SQL Server’s built-in authentication method. Chiefly is that login passwords get transmitted unencrypted and can be seen using packet sniffing.

For best results leave use Windows Authentication mode only and make sure your applications authenticate via Windows. Certain applications do not support Windows authentication so check carefully with the vendor in case any patches or reconfiguration are required.

Tip 4a: If You Must Use Mixed Authentication Disable the ‘sa’ Account.

The sa account in SQL Server is a very special one. It has the SID of 0x01 and is considered the most powerful account in SQL Server. It’s also the most vulnerable one being so well known. For best results leave sa disabled and rename it. That way it can’t be used to exploit the whole instance.

Tip 5: Consider Firewall Rules

The Windows or Linux firewall should be enabled on each operating system for SQL Server. Connectivity to SQL Server is via the default port 1433/tcp. A rule needs to be in place to allow traffic to and from the server.

Locking down firewall rules to only allow access via known application servers, authorised management PCs and restricted virtual desktops is highly recommended. This effectively stops any malicious login attempts from unauthorised hosts. This can help keep your SQL Server instance safe.

Conclusion

In this post we’ve discussed the importance of protecting your organisation’s data as well as the theory over a number of basic steps for securely deploying SQL Server instances including: secure configuration, updates, firewall controls as well as encryption in transit.

Once the SQL Server instance is promoted to production there are also other features of SQL Server that should be considered such Transparent Data Encryption (TDE) for encrypting SQL Server databases, logs and backups.

If your organisation is facing challenges over securing your SQL Server instances then help is at hand. Digital Incite and Matter Ltd can help further with this challenging subject. We also have experience helping clients with annual security audits. Get in touch with us today for a free initial consultation.

Something Went Wrong – A Crash Course in Providing a SQL Trace File

We’re all (probably) familiar with the error message Something Went Wrong. You might also receive a long string of numbers, get told to try again later and report the error to an administrator. These kind of messages aren’t really helpful by themselves.

Regardless of where this error is coming from you need to get a better understanding of what’s actually going wrong in order to be able to work out what to do to address it or even to determine if you need to do anything about it.

In SQL Server there are two features which can be used to provide in-depth information: the SQL Server Profiler and Extended Events. As a SQL Server and/or application administrator learning to use these tools is a critical skill in responding to application errors.

Before we go into any further depth it’s necessary to mention that SQL Server Profiler and also the SQL Trace events are marked as deprecated by Microsoft. This means that the features are no longer being developed and will be removed in future versions of SQL Server. That also means you should learn Extended Events for future reference.

From professional experience however many application vendors we work with will still request an SQL Server Trace file (with a .trc extension) so if you need such a trace to add to a support ticket read on.

A Basic SQL Server Trace

Before any trace is started on the SQL Server instance please be aware that this activity can…will place a significant strain on server resources. This could either be the amount of disk space required for the capture or the impact to processing performance. With this in mind you should try to organise an SQL Trace session when you have either exclusive access to the application database or that you know that it will be a quiet time (i.e. after regular office hours). If you are doing this for the first time definitely practice on a test/training environment before working on production.

The settings I’ll go through here are to be considered a basic trace only. If you are being asked to provide a trace file you should always first check with the software author or your DBA asking what events they need to see in the trace. You can then either open their trace template or use the instructions below to select the trace criteria they require.

Please note that the following was performed on SQL Server 2022 with SQL Server Management Studio (SSMS) 20.2. The SQL Server Profiler has very much been the same with all prior versions so don’t expect any major deviations in the instructions.

Step 1: Launch SQL Server Profiler from either the start menu or from SQL Server Management Studio from Tools > SQL Server Profiler. Login with a user that has permissions for ALTER TRACE by clicking Connect.

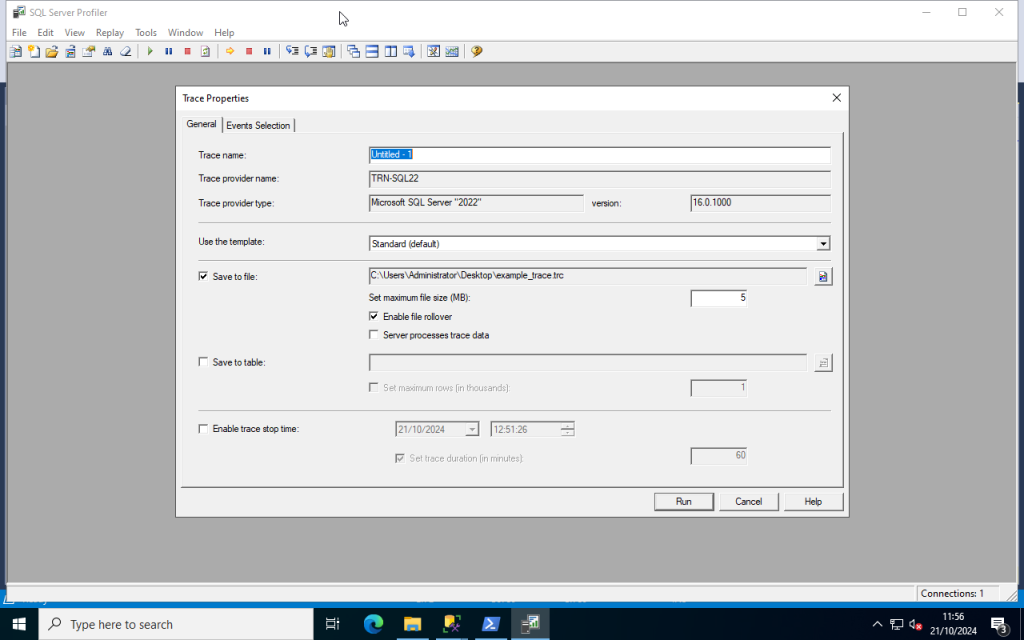
Step 2: On the first tab – General – we need to setup the basics of the trace:

  • Give the trace a suitable name.
  • For a template use Standard (default) for now.
  • Check Save to File. This will then prompt a save location.
    • Set maximum file size (MB): up this to 100 MB
    • I recommend leaving Enable file rollover checked. This will create multiple trace files as necessary.
SQL Server Profiler - General Tab

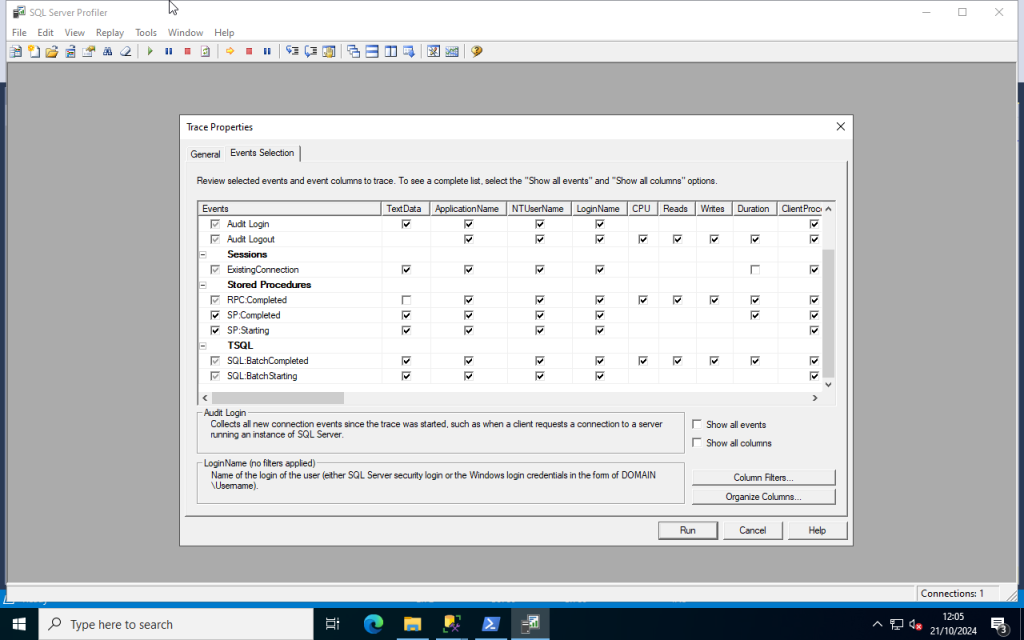
Step 3: On the second tab – Events Selection – you will now select the events you want to capture. As we selected the Standard (default) template we have a set of pre-selected events to work with already. I suggest adding a few more in order to get a slightly more useful trace:

  • Click Show all events and Show all columns to see the full list.
  • Select the additional rows using the checkbox to the left of the event:
    • Errors and Warnings
      • User Error Message
    • Stored Procedures
      • SP:Completed
      • SP:Starting
  • Finally uncheck Show all events to only display what events you have selected. Have a little review to make sure the ones suggested have been selected.
SQL Server Profiler - Select Events

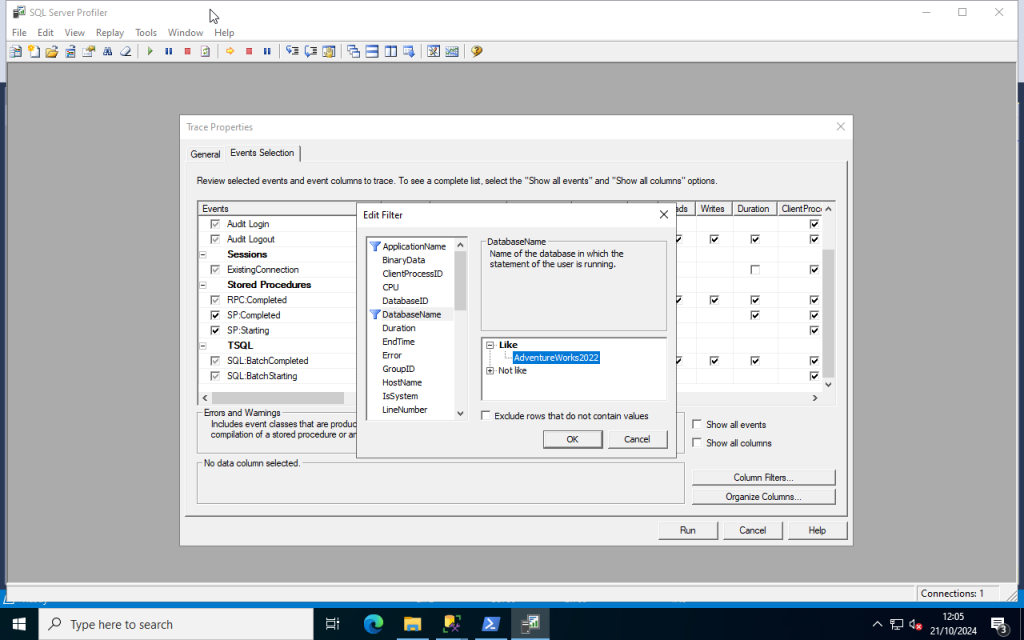
Ideally we should filter the trace events to those for the required database(s) only. This can be done by clicking the Column Filters button. On the left scroll to find the DatabaseName filter. Expand the Like operator on the right of the Window then type in the name of the database you want to Trace for. Click OK once you have your databases listed.

SQL Server Profiler - Edit Filter

Step 4: Click run to start the trace. You will see the trace window appear with events being logged. Don’t worry if the events are flying past too quick. The SQL Server Profiler by default will continuously scroll to the bottom.

Notice that there is also now a trace file saved to the path you specified in Step 2.

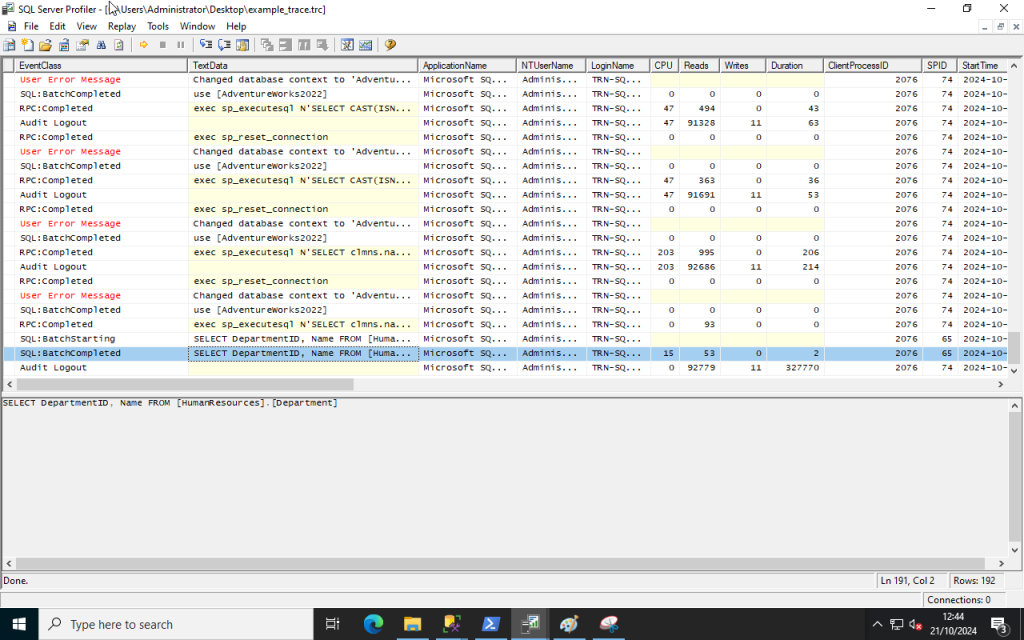
Step 5: Either get your colleague to replicate the problem in the application or follow their replication steps yourself. In this example I captured doing a simple select statement from AdventureWorks.

SQL Server Profiler - Trace Results

At this point note the two highlighted buttons on the screenshot below. The left “stop” button (Stop Selected Trace) will end the trace and stop SQL Server Profiler from capturing events. The right button (Auto Scroll Window) will stop the window scrolling if you need to quickly study a series of events you have noticed whilst keeping the trace capturing new events.

SQL Server Profiler - Menu Buttons

Once you have finished live analysis make sure to click the Stop Selected Trace button. As mentioned SQL Server Profiler running a trace will have a significant performance impact to the SQL Server instance so don’t leave it!

The aforementioned trace file can now be securely transferred to the software author or you can re-open it later and review it any time you want.

In the SQL Server Profiler window you’ll no doubt see many different events and also captured text in the bottom half of the Profiler window. By studying what the SQL Server engine is doing we can begin the process of troubleshooting problematic or unexpected application behaviour. Whilst the level of information in an SQL Server trace will be comprehensive it’s necessary to take the time to study it properly.

Conclusion

In this blog post we’ve learned to create a basic trace file in SQL Server. Whilst only a basic trace additional events can be captured as well as additional filters specified to help us understand application behaviour when an issue is reported.

If you need further support Digital Incite and Matter can not only help create the requested trace file but we can also work with your software provider to manage the incident case from diagnosis to patch deployment. Please get in touch with us today for further assistance.

Performance Tuning SQL Server Queries

Let’s imagine that you’ve just come back from summer holidays. You’ve been away travelling, enjoying life and having a relaxing time. Crash down back to work in September (sadly) and you’ve been asked to write some T-SQL based queries. Maybe it’s for a new dashboard component, report lines or even a new view. Somehow that query isn’t performing as you or a colleague expect. Panic sets in as you look blankly at the query and think “what do I do?!?!”.

Don’t fret; performance issues with T-SQL queries happen. Most of the time it’s an issue that can be fixed very quickly. If you find you’ve gone a bit rusty over summer here’s five quick tips to help you troubleshoot those queries:

Tip 1: Check For Obvious Offenders

Quite often you’ll find your issue by re-reading your T-SQL code and making some adjustments. Common causes could be:

  • Avoid Using SELECT *. Whilst this is sometimes OK to get an understanding of the table contents what it does result in absolutely everything in the table being retrieved. Not only is the full set of data unnecessary but you may also be impacting other queries executing simultaneously on the instance.
  • Check for complex joins. Occasionally a table join will introduce a complex operation that SQL Server must complete to get the matching rows. Check that your joins are appropriate for the data you want to select.
  • Consider using the WITH(NOLOCK) hint on live OLTP databases. This prevents queries from locking the table and blocking other queries. This may result in dirty reads so watch out!
  • Not obvious where the query is going slow? Break the query down bit by bit and re-introduce statements one at a time until you find the offending part of the query.

Tip 2: Check the Query Execution Plan

An automatic go-to for understanding how SQL Server is working at the engine level is to include the Execution Plan. In SQL Server Management Studio (SSMS) you can enable this option on the menu bar at the top.

SQL Server Management Studio showing how to enable Execution Plan

Once your query has been executed and completed the actual query execution plan will be displayed as a tab next to the results window. Within the execution plan check for expensive operations, missing indexes and also any other pertinent issues that might be causing your problem. Some execution plans end up quite in depth so take some time to study each part of the plan.

Once you have an understanding of you SQL Server is trying to perform your query you can then go make adjustments to your T-SQL or work with your DBA on the potential bottlenecks the execution plan helped you identify.

Tip 3: Check Indexes

In SQL Server Indexes are used to help the database engine perform the most efficient lookup of data possible. Having indexes in place is imperative to a production database especially where the number of records becomes substantial. Without indexes the database engine must perform more complex lookups of the data held in a table which takes longer to complete versus tables that have appropriate indexes designed.

Check the execution plan for Index Scans and Seeks. Index Scans are more intensive as they mean that the whole table is being looked up whereas an Index Seek means only the matching records. An Index Seek is generally preferable except in certain circumstances where there are a large numbers of matching records in a table. You will also see a warning box at the top of the execution plan if SQL Server has identified a missing index that may have helped the query.

Tip 4: Index Defragmentation and Statistics Update Jobs

As discussed in the previous tip indexes and statistics are important in maintaining adequate database query performance. Over time the indexes on a table will become fragmented and the statistics become out of date. This will gradually harm performance over the course of time. If you find your existing queries are getting slower, slower and slower then this is a probable cause.

Check the system view sys.dm_db_index_physical_stats for your particular database. If the avg_fragmentation_in_percent value for your indexes are running high check on the SQL Server instance that an Agent job or maintenance plan is in place to perform a regular index reorganise or an index rebuild for heavily fragmented indexes.

Depending on how the SQL Server instance is configured statistics may be updated automatically however there should also be an SQL Server Agent job or maintenance plan to update index and/or column statistics on a regular basis as appropriate.

Tip 5: Use the Query Store

The Query Store is a useful feature that was introduced in SQL Server 2016. It is not enabled by default unless you are working with SQL Server 2022 and have created a new database. Not only does the Query Store contain a number of useful reports that help you understand how queries are performing in your SQL Server instance but from SQL Server 2017 it enables the Automatic Tuning functionality.

If the Query Store is not enabled then it may be enabled on a per database via SQL Server Management Studio or T-SQL like so:

ALTER DATABASE <my_database>
SET QUERY_STORE = ON (WITH OPERATION_MODE = READ_WRITE)

Once the Query Store is on you need to let it run for a while to let it capture sufficient data. Whilst this is going on take some time to review the Query Store for information on query regressions and potentially make adjustments to the query accordingly.

Once you have captured sufficient data you can then enable automatic tuning on your database like so:

ALTER DATABASE <my_database>
SET AUTOMATIC_TUNING ( FORCE_LAST_GOOD_PLAN = ON );

Still Having Issues?

If you find yourself still having performance issues then perhaps it’s time to bring in a consultant to help you out. Digital Incite and Matter are proficient at query writing and optimisation. If you issue lies beyond the obvious then we can also advise on the infrastructure, instance configuration and expanded troubleshooting.

Get in touch with us today and we’ll be pleased to assist you further.

SQL Server Health Checking

These past few weeks I’ve been working on health checking a client’s SQL Server 2017 instance that hosts databases for their finance and spend-control applications. In my suite of tests there were over 70 different points checked across SQL Server and the applications to ensure that they were operating at peak potential.

Three useful things you can do to quick check a SQL Server instance even if you don’t have a DBA or SQL management skills yourself:

1. Check the installed Cumulative Update (CU)

SQL Server itself is a highly tested product and usually you’d not expect to have any serious issues in production. From time to time though there are security, performance and functional updates released for the product. It’s recommended to frequently apply the latest Cumulative Update or “CU”. These are highly tested updates that are certified to the same level as what a service pack used to be.

You can check the currently installed CU via installed updates in add/remove programs, by comparing the version string in the properties of the SQL Server instance in SQL Server Management Studio (SSMS) or referring to documentation your SQL Server installation consultant gave to you.

If your instance of SQL Server is no longer supported then it’s time to plan out an upgrade.

2. Check the free disk space

SQL data files, log files and backups can grow to consume a lot of space. These files are necessary for a full functioning SQL Server instance. It’s therefore necessary to manage the disks they are stored on.

If SQL Server runs out of space it will follow the database settings for Autogrowth if switched on. If there’s no data to allow the growth to occur then SQL Server will return an error instead which the end user will then somehow experience (error message, timeout, nothing happening).

As for backups that’s a lot more straightforward; no disk free then no backup.

Simply check these by looking at free disk space in File Explorer and then consider expanding the disks, moving files about or planning a migration to a server with more storage. Another important note that you should avoid shrinking production databases. Yes, it’s best to allow disk space to be pre-allocated to SQL Server databases! This avoids fragmentation which can reduce performance and also delays in response due to the database engine awaiting the disk to allocate more space.

3. Checking over the host Operating System.

Your SQL Server will only ever be as good as the operating system it’s hosted upon. You should periodically check that the latest updates are applied to the OS, ensure that there are no major events that need attention logged in Windows Event viewer and also ensure that CPU and memory aren’t under pressure from other applications.

This by all means isn’t a comprehensive list of things you should be checking on a SQL Server but it’s relatively easy to do for someone who has sysadmin skills for Windows Server (or even Linux).

If you have performance, security or operational issues with SQL Server don’t hesitate to get in touch with us at Digital Incite and Matter Ltd. We are experts in maintaining mission critical SQL Server instances for organisations of all shapes and sizes.

Compatibility Is Key!

This will be the final semi-regular post of the year so before I get into the subject I’d like to say a brief thanks for your readership over the year!

This week I have been focused more on the platform side of things: organising updates on our VMWare ESXi host with our data centre and preparing for an upcoming attempt at Cyber Essentials certification. In other words not that much on SQL Server this week but still had a dabble when called for.

It has come to my attention that you can’t licence SQL Server 2016 or 2017 through distributors any more. You’ll have to pardon my ignorance on licensing as through my main job we don’t do the SQL Server licensing. Either there’s already an SQL Server there or a new one is deployed.

I recently did a rapid-fire upgrade for a client which called for a move of an existing application from Windows Server 2012 R2 and SQL Server 2012 infrastructure. Because of the age of the application running there which wasn’t to be upgraded the design called for Windows Server 2016 and SQL Server 2016 to be used as these were the highest supported. Unfortunately the client’s IT were not able to source SQL Server 2016 from their distributors any more.

This is a nice segue into SQL Server compatibility levels, what they are and what they are used for and how that could save us.

Every database connected to a SQL Server instance has a compatibility level set. By default for a new database it will be the compatibility level for that particular version of SQL Server that’s been installed (unless the instance has been upgraded but that’s a different matter). The database compatibility level is used by the Database Engine to control what specific SQL Server behaviours and changes are used for that database. If you want to know more then Microsoft have that in their documentation if you fancy a detour.

The official word from Microsoft is that you certify an application against the database compatibility level and not the SQL Server instance version. In other words it’s valid to have a SQL Server 2022 (160) instance and connect databases with a SQL Server 2014 (120) database to it with a corresponding compatibility level to maintain backwards compatibility. Your application vendor might begrudgingly disagree with that policy though so check in with them first.

Examining and Changing the Database Compatibility Level

In SQL Server Management Studio the easiest way to determine the database compatibility level is by right clicking your target database > properties > Options tab. The current compatibility level is displayed in the window.

SELECT [name],[compatibility_level]
FROM sys.databases

You’ll notice that the compatibility level is not 2022, 2019, 2017 etc but a number corresponding to the product version of the SQL Server instead.

If you determine that a compatibility level change is required you can set a new level using the following command:

ALTER DATABASE [MyDatabase]
SET COMPATIBILITY_LEVEL = 160 | 150 | 140 | 130 | 120 | etc

You should note that you may experience query regressions when moving up compatibility levels. The usual reminder to test carefully before deploying to production counts here!

Discussing Authentication Modes in SQL Server

I have been on holiday for the past two weeks but just before I left the subject came up with a client regarding authentication methods in SQL Server. Whether you are logging in using SQL Server Management Studio (SSMS) to make queries or configuring an application to work with SQL Server the authentication method is important to consider. 

By authentication we mean a process a user must complete to gain access to a system. SQL Server roles and rights fall under authorisation – determining what access a user has in a system – which I’ll discuss another time.  

When you install a fresh SQL Server instance on Windows you’ll be prompted regarding the authentication mode to have it in: 

  • Windows – Default and enables Active Directory authentication only. 
  • Mixed – Enables both Active Directory and SQL Server’s built in authentication method 

You also get to specify what AD users and groups to add to the sysadmin role. When I do this for clients I make sure to identify the users or DBA groups to add. Adding the domain admins group I would advise avoiding unless as a last resort because given that sysadmin has read permissions on data in all databases there should still be a separation of roles between an IT admin and someone in an organisation who has a both requirement & trust to access that information. 

If you change your mind later on after the install you can switch between modes in the instance properties in SSMS or using the registry. 

I recommend if possible that an SQL Server instance uses Windows Authentication. This is because it’s simply put the most secure form of authentication of the two. 

Windows Authentication makes use of an organisation’s existing Active Directory user directory. This mode is always active and is often referred to as “Trusted”. I’ll not go into the exact workings of Active Directory authentication in this post but the critical point is that SQL Server is not performing the authentication itself. Instead the authentication is done against Active Directory by passing back authentication tokens. A slight downside would be that this creates a dependency on a working and redundant Active Directory Domain Services setup (read: ideally two servers with AD replication working and healthy).  

When using an SQL Server authenticated login this will use SQL Server’s own authentication scheme which is much weaker than Active Directory. An example of how much weaker this is would be that in the communication between the client and SQL Server instance you’ll find the password sent in plain text. 

Special Note On The sa Account 

There’s a default account in SQL Server which by default and on installation is named ‘sa’. This is the most powerful account in any SQL Server instance and has the SID 0x01. 

I often get asked the question either in handover or in a support query about the sa account and my answer is always that I don’t use it. Applications, MSPs and consultants that ask for this account lose a few points for doing so. Using the sa account to configure an application or for general use is an absolute no. 

I highly recommend leaving the sa account disabled. It’s also recommended to rename this account as an attacker can usually assume there is an account named sa on the instance to try for. 

As a safer alternative giving users named logins is highly recommended for accountability purposes instead of a shared account. 

Note that if you install SQL Server in Windows Authentication mode the sa account is still created but with a random password and left disabled. 

Database Configuration Checks With The sys.databases View in SQL Server

Recently building a system and preparing to handover the system to a colleague who will be completing the build they asked how they SQL Server databases were configured for the transaction logs, compatibility levels and other things before before other data was loaded in.

To answer questions on that regard you could go through each database one-by-one in SQL Server Management Studio to check the configuration but that’s going to get fairly tedious really fast.

As I’ve said before it’s often best to try and script things out to save them for later rather than poking through the GUIs all the time so this is where building something you can repeatedly use comes in. In this instance the view sys.databases is a really useful one to know.

I’ve built myself a T-SQL script that I use to bring out useful information I can then copy out for documentation or just a quick check of the databases. This script is available in my GitLab repo for you to try. My recommendation would be to modify to your requirements or be an inspiration to build your own.

Your SQL login needs to have ALTER ANY DATABASE, VIEW ANY DATABASE or CREATE DATABASE permission at server level or be in the SYASADMIN server role. If you call the view any database you have the db_owner role over will appear too.

This script I use to give a quick check following building a new system. Just an an example it’s usually a really good idea to have AUTO CLOSE and AUTO SHRINK set to OFF on production databases. Sometimes clients might set these on as they sound like a good idea just by reading them. With sys.databases this is an example of option you can check to see what’s configured for either general checks or troubleshooting purpose.

My invitation to you is to check out my script, leave me a few comments and have fun building your own.

Making Yourself A Quick Backup in SQL Server

A nice a and simple one to share this week. Often when giving SQL Server consultancy I have to make backups at points before I’m doing something hazardous in a client’s database. This might be patching or running a script for example. It’s best to take your own backups just in case something doesn’t go to plan.

I occasionally see people fumbling around the GUI of SQL Server Management Studio to do backups and when there’s multiple databases to do it can really get clunky. There’s an argument to say that often it’s better to learn to script rather than work through GUIs. I certainly agree. Learning to do things in SQL Server via T-SQL commands means you can save them for later and also save a lot of time.

Your most basic command to backup a SQL database is as so:

BACKUP DATABASE [MyDatabase] TO DISK = N'Backup_Mydatabase.bak' WITH COPY_ONLY, COMPRESSION, STATS= 10

That’s really it for you GUI fans.

Let’s break this down further and look at the arguments after the BACKUP DATABASE command:

TO DISK = N’Backup_Mydatabase.bak’ – instructs SQL Server to make the backup to the disk with the name as specified. In SQL Server 2008 R2 and above the backup path can be seen in SSMS by right click the instance name > Properties > Database settings tab and note the path for Backups right at the bottom. Prior to (if I remember correctly) SQL Server 2008 R2 this backup path needed to be specified in full. You can specify a full path if you want to backup elsewhere but you need to ensure that SQL Server has permissions there.

COPY_ONLY – this option instructs SQL Server to only make a copy of the database and not record it in the backup chain. What this means is that if you have a disaster and want to recover then the backup you have just taken isn’t considered the last full backup in the chain. You should consider using this option for copying databases to another server and also for backups outside the normal backup routine.

COMPRESSION – applies compression to the backup. Leaving this off will mean SQL Server will follow the server’s default setting. I have the habit of doing this because unplanned backups take space somewhere and adding unplanned backups can tip the balance if you’re not careful. This being said you should always check space before making backups and restores.

STATS = 10 – this is a useful argument to add on as in the messages tab of SQL Server Management Studio this will give you a progress message at every interval which is a multiple of the number you have specified. So for 10 for example it will say when it’s reached 10%, 20%, 30% and so on up to 100%. This is handy to know as the backup progresses so you can estimate how far off completion you are.