Let’s imagine that you’ve just come back from summer holidays. You’ve been away travelling, enjoying life and having a relaxing time. Crash down back to work in September (sadly) and you’ve been asked to write some T-SQL based queries. Maybe it’s for a new dashboard component, report lines or even a new view. Somehow that query isn’t performing as you or a colleague expect. Panic sets in as you look blankly at the query and think “what do I do?!?!”.
Don’t fret; performance issues with T-SQL queries happen. Most of the time it’s an issue that can be fixed very quickly. If you find you’ve gone a bit rusty over summer here’s five quick tips to help you troubleshoot those queries:
Tip 1: Check For Obvious Offenders
Quite often you’ll find your issue by re-reading your T-SQL code and making some adjustments. Common causes could be:
- Avoid Using SELECT *. Whilst this is sometimes OK to get an understanding of the table contents what it does result in absolutely everything in the table being retrieved. Not only is the full set of data unnecessary but you may also be impacting other queries executing simultaneously on the instance.
- Check for complex joins. Occasionally a table join will introduce a complex operation that SQL Server must complete to get the matching rows. Check that your joins are appropriate for the data you want to select.
- Consider using the WITH(NOLOCK) hint on live OLTP databases. This prevents queries from locking the table and blocking other queries. This may result in dirty reads so watch out!
- Not obvious where the query is going slow? Break the query down bit by bit and re-introduce statements one at a time until you find the offending part of the query.
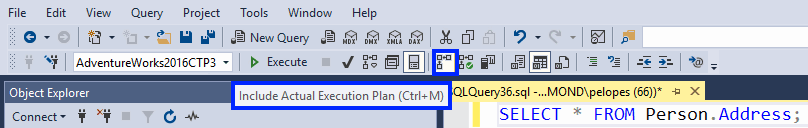
Tip 2: Check the Query Execution Plan
An automatic go-to for understanding how SQL Server is working at the engine level is to include the Execution Plan. In SQL Server Management Studio (SSMS) you can enable this option on the menu bar at the top.
Once your query has been executed and completed the actual query execution plan will be displayed as a tab next to the results window. Within the execution plan check for expensive operations, missing indexes and also any other pertinent issues that might be causing your problem. Some execution plans end up quite in depth so take some time to study each part of the plan.
Once you have an understanding of you SQL Server is trying to perform your query you can then go make adjustments to your T-SQL or work with your DBA on the potential bottlenecks the execution plan helped you identify.
Tip 3: Check Indexes
In SQL Server Indexes are used to help the database engine perform the most efficient lookup of data possible. Having indexes in place is imperative to a production database especially where the number of records becomes substantial. Without indexes the database engine must perform more complex lookups of the data held in a table which takes longer to complete versus tables that have appropriate indexes designed.
Check the execution plan for Index Scans and Seeks. Index Scans are more intensive as they mean that the whole table is being looked up whereas an Index Seek means only the matching records. An Index Seek is generally preferable except in certain circumstances where there are a large numbers of matching records in a table. You will also see a warning box at the top of the execution plan if SQL Server has identified a missing index that may have helped the query.
Tip 4: Index Defragmentation and Statistics Update Jobs
As discussed in the previous tip indexes and statistics are important in maintaining adequate database query performance. Over time the indexes on a table will become fragmented and the statistics become out of date. This will gradually harm performance over the course of time. If you find your existing queries are getting slower, slower and slower then this is a probable cause.
Check the system view sys.dm_db_index_physical_stats for your particular database. If the avg_fragmentation_in_percent value for your indexes are running high check on the SQL Server instance that an Agent job or maintenance plan is in place to perform a regular index reorganise or an index rebuild for heavily fragmented indexes.
Depending on how the SQL Server instance is configured statistics may be updated automatically however there should also be an SQL Server Agent job or maintenance plan to update index and/or column statistics on a regular basis as appropriate.
Tip 5: Use the Query Store
The Query Store is a useful feature that was introduced in SQL Server 2016. It is not enabled by default unless you are working with SQL Server 2022 and have created a new database. Not only does the Query Store contain a number of useful reports that help you understand how queries are performing in your SQL Server instance but from SQL Server 2017 it enables the Automatic Tuning functionality.
If the Query Store is not enabled then it may be enabled on a per database via SQL Server Management Studio or T-SQL like so:
ALTER DATABASE <my_database>
SET QUERY_STORE = ON (WITH OPERATION_MODE = READ_WRITE)
Once the Query Store is on you need to let it run for a while to let it capture sufficient data. Whilst this is going on take some time to review the Query Store for information on query regressions and potentially make adjustments to the query accordingly.
Once you have captured sufficient data you can then enable automatic tuning on your database like so:
ALTER DATABASE <my_database>
SET AUTOMATIC_TUNING ( FORCE_LAST_GOOD_PLAN = ON );
Still Having Issues?
If you find yourself still having performance issues then perhaps it’s time to bring in a consultant to help you out. Digital Incite and Matter are proficient at query writing and optimisation. If you issue lies beyond the obvious then we can also advise on the infrastructure, instance configuration and expanded troubleshooting.
Get in touch with us today and we’ll be pleased to assist you further.