Crash Course: SQL Server Extended Events

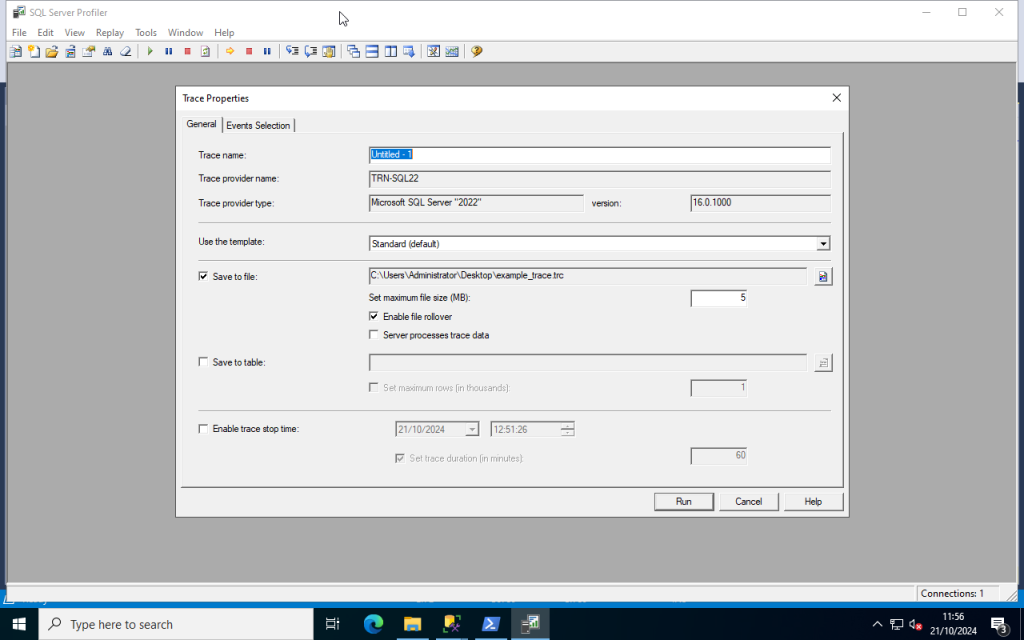
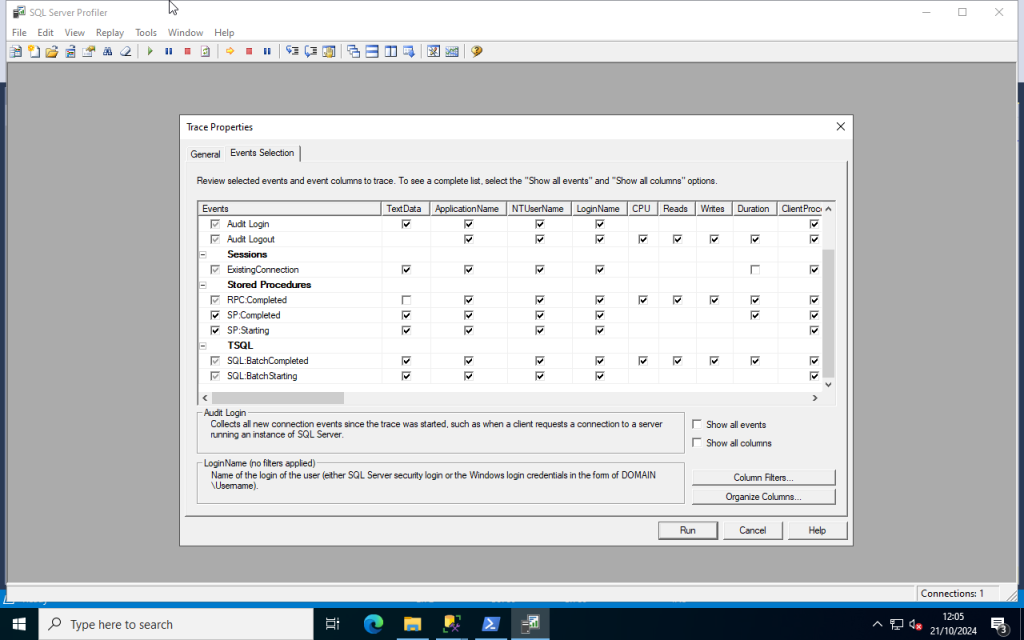
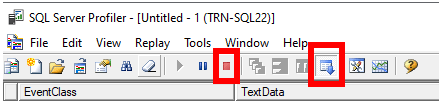
I’ve previously written about SQL Server Profiler and its use in diagnosing problematic T-SQL queries, stored procedures, and application behaviours. Although the SQL Server Profiler is very much the trusted tool for doing so it’s actually marked as deprecated by Microsoft. This unfortunately means that it will be removed in a future version of SQL Server.

In place of Profiler there is another feature called Extended Events (also referred to as XEvents or XEs). As Microsoft’s intended replacement for the Profiler it’s important to learn how this feature works in anticipation for a future release of SQL Server where Profiler is no longer available.

A key advantage of Extended Events is that they are less performance intensive than what SQL Server Profiler is and that they are designed to be left running to collect data. You’ll also notice that Extended Event sessions are all done directly in SSMS rather than launching a separate tool. As sessions are stored as objects within the SQL Server instance other DBAs can also make use of them.

Let’s work through a simple Extended Event session that will capture SQL queries being made in an AdventureWorks2022 test database.

Note: the following example was done on SQL Server 2022 CU17 running on Windows Server 2022 update 2025-01. SQL Server Management Studio 20.2 was used

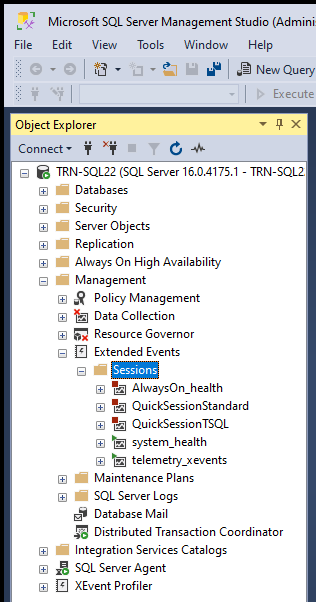
Step 1: Launch SSMS from the start menu, login to the required SQL Server instance. Once you are logged in goto Instance Name > Management > Extended Events

Step 2: Create a session by right clicking the Sessions folder and clicking New Session Wizard.

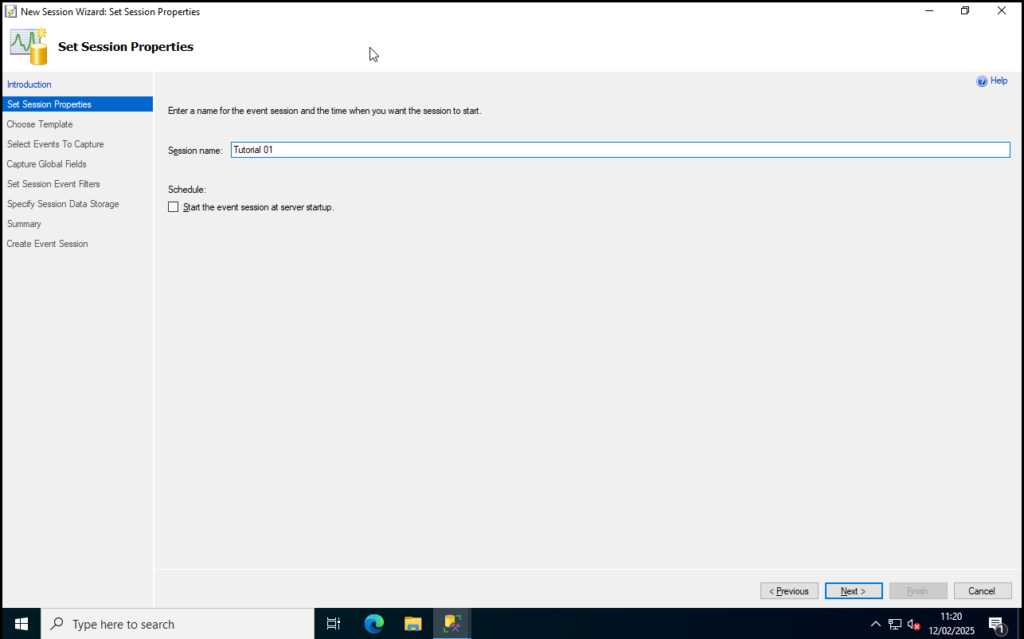
Step 3: Click Next to skip past the introduction.

Step 4: Give your XEvent Session a descriptive name. For this example I’ve just used Tutorial 01. Click Next to proceed.

SSMS: Session Properties

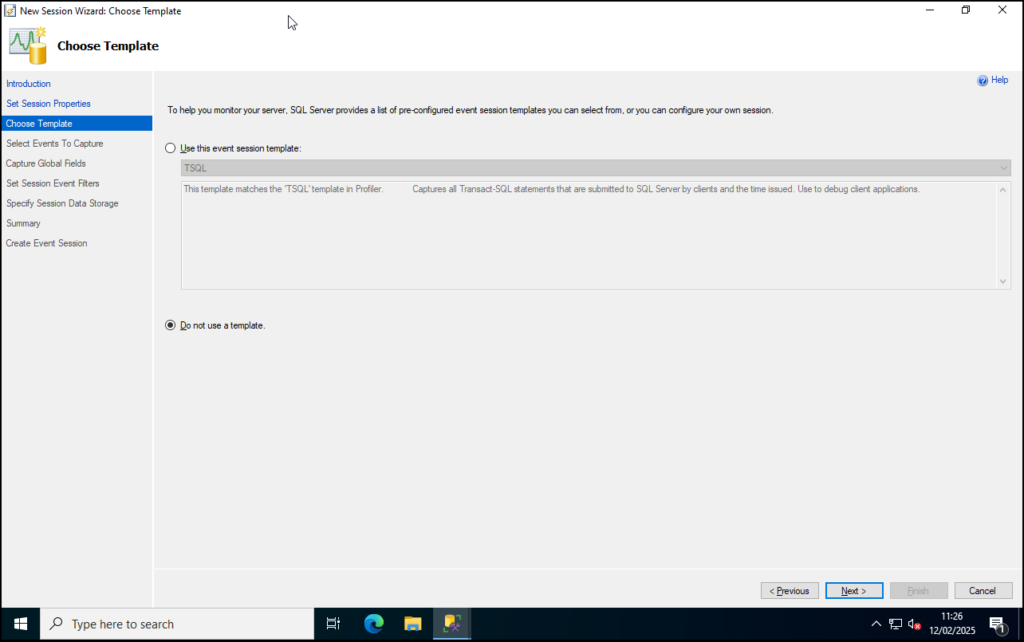
Step 5: Although there are some templates to choose from select Do not use a template and click Next.

SSMS: Templates

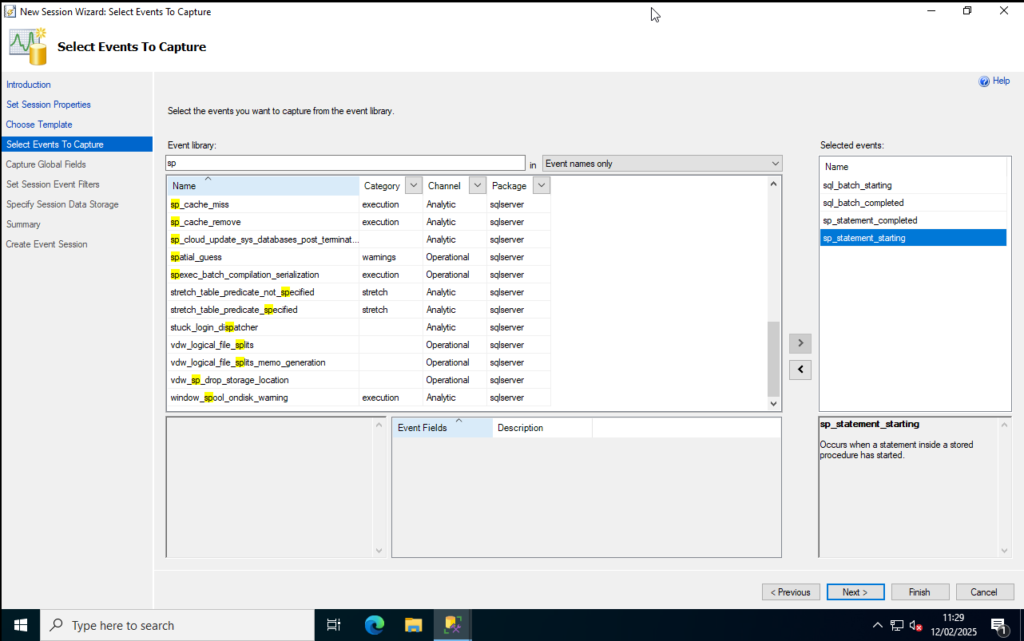
Step 6: This page now allows you to select events you want to track. Search for the following events and then double click each line to add to the list to the right. Click Next once you have them all:

  • sql_batch_starting
  • sql_batch_completed
  • sp_statement_starting
  • sp_statement_completed
SSMS: Events To Capture

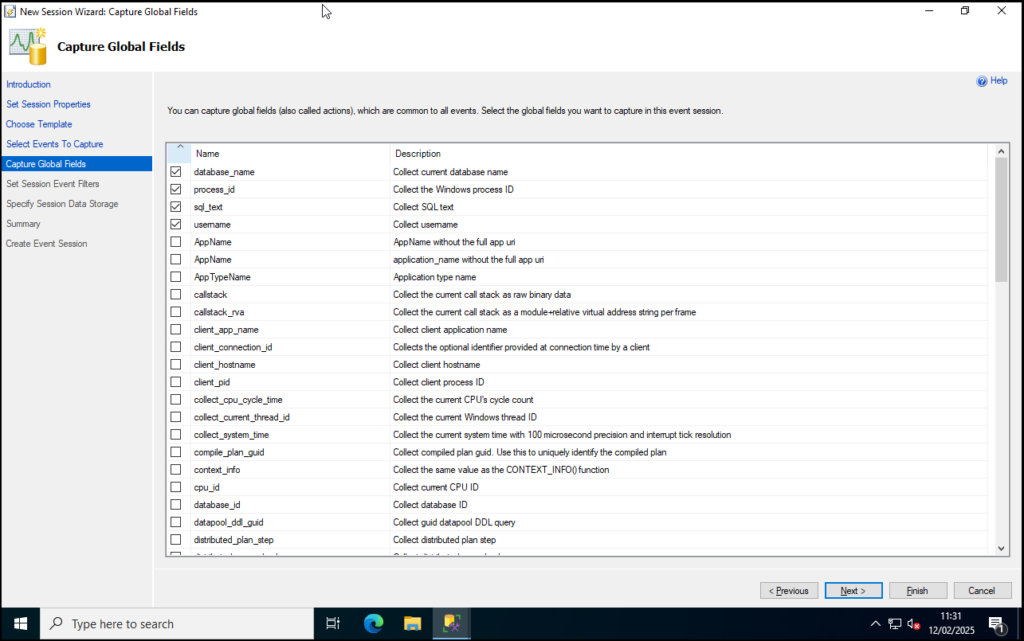
Step 7: In the list of global events to track let’s select the following and then click Next:

  • database_name
  • process_id
  • sql_text
  • username
SSMS: Capture Global Fields

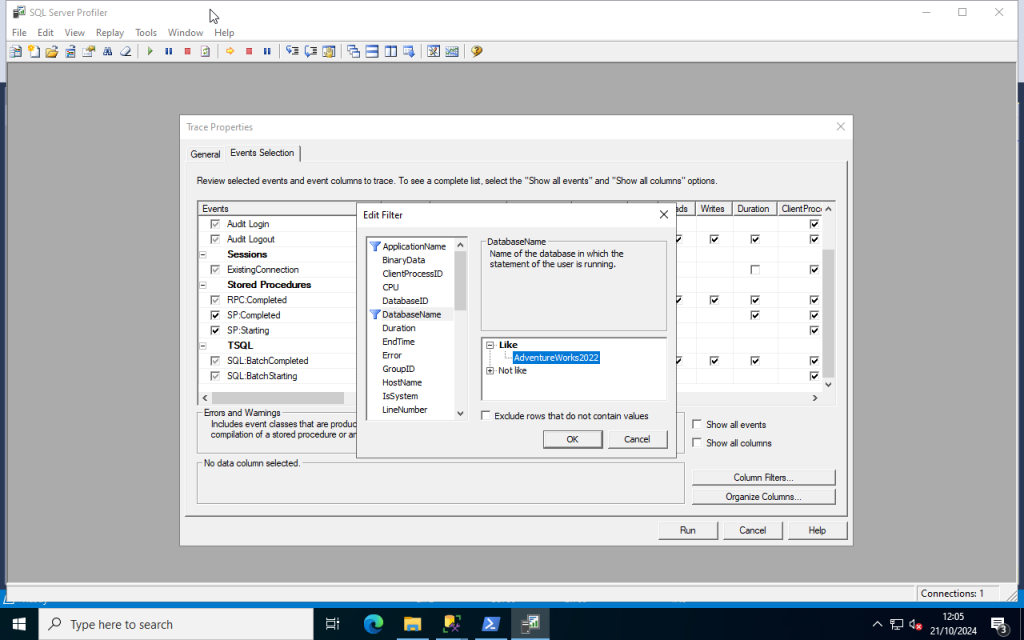
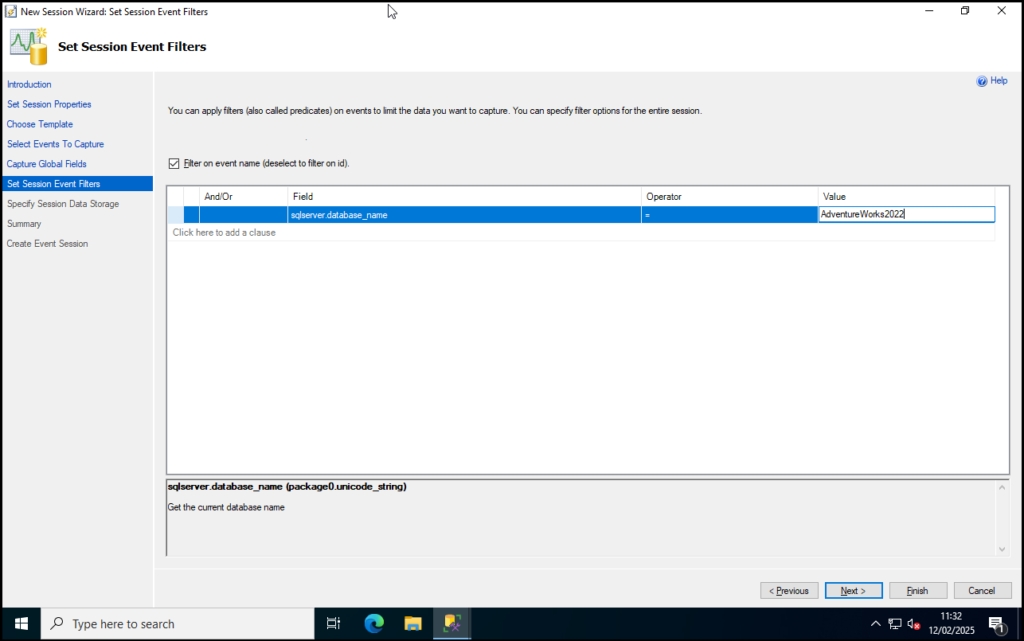
Step 8: For filters I’m going to add in a line to narrow down the XEvent to AdventureWorks2022 using the filter sqlserver.database_name. Click Next once set:

SSMS: Sesseion Event Filters

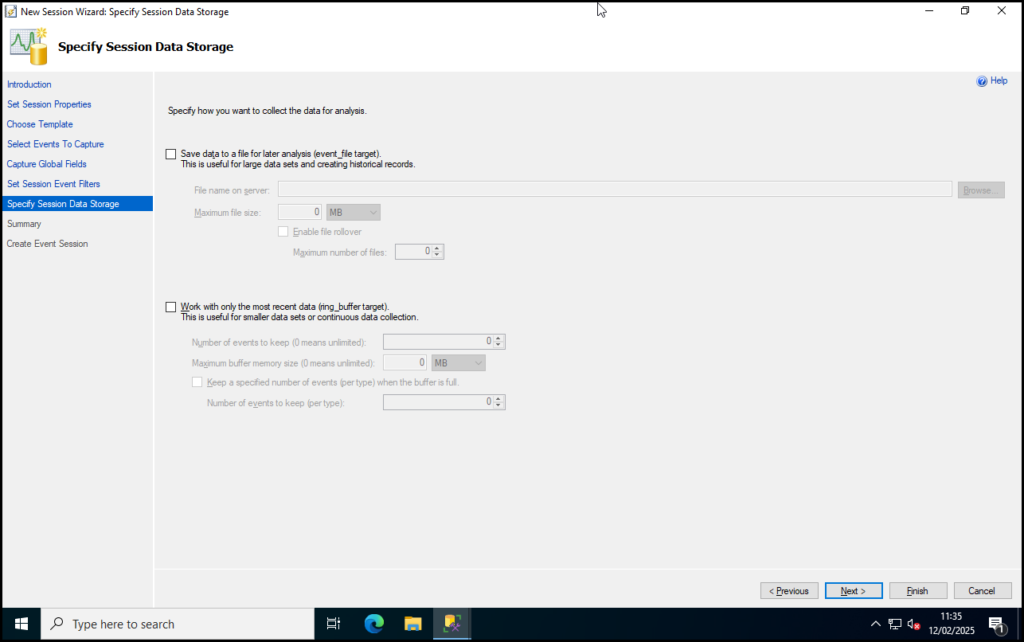
Step 9: Leave the data storage options unchecked for now. We’re only going to demo this XEvent so we aren’t interested in keeping the data. Click Next.

SSMS: XEvent Storage Options

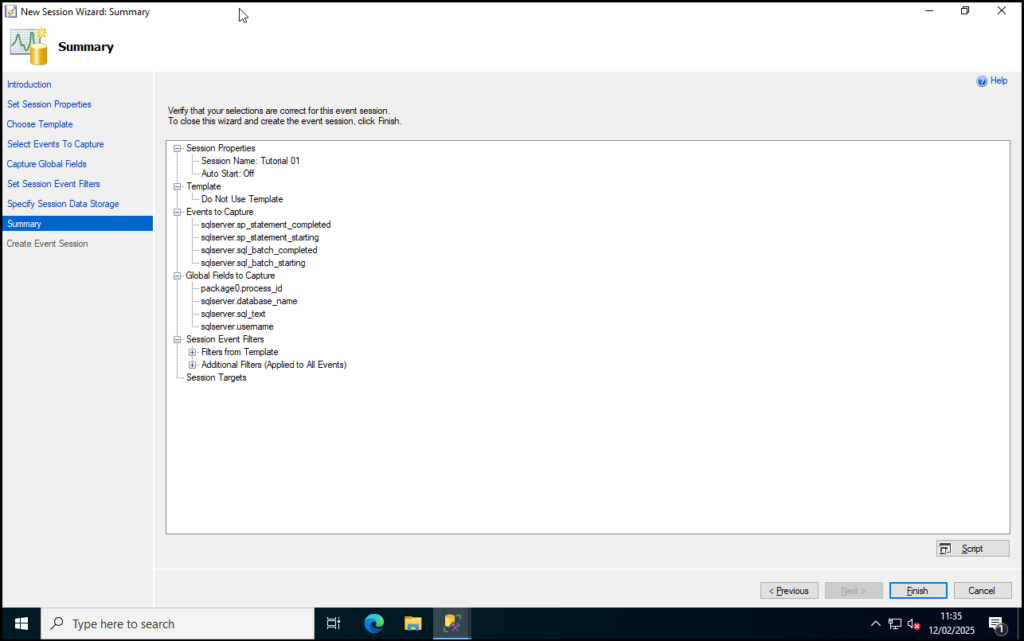
Step 10: Review the summary and click Finish when you are satisfied with your selections.

SSMS: XEvent Summary

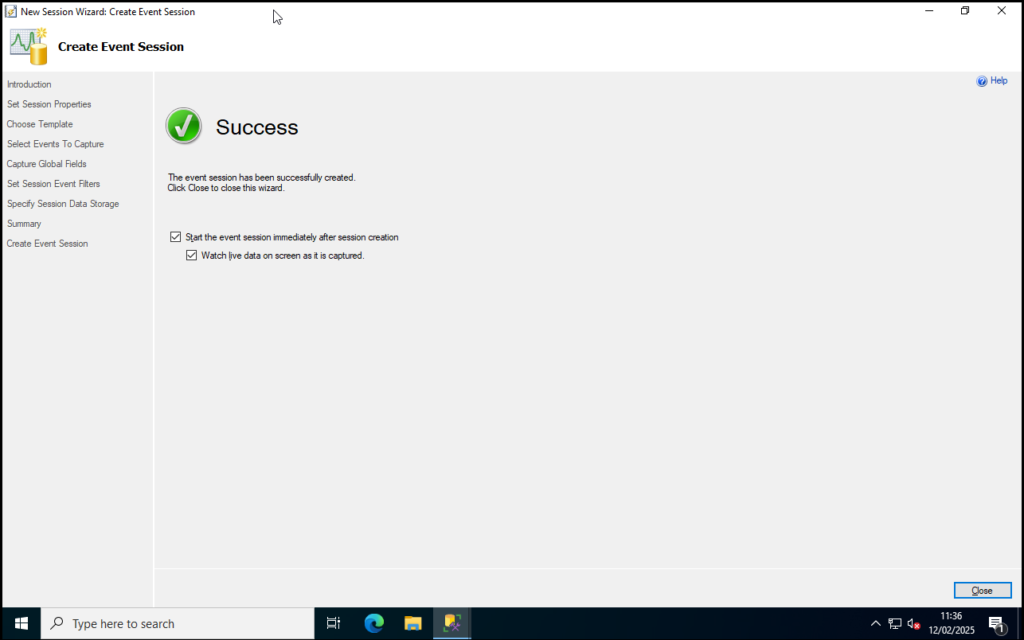
Step 11: As we’d like to make use of this XEvent straight away check both options on the Summary screen then click Close.

SSMS: XEvent Summary Screen

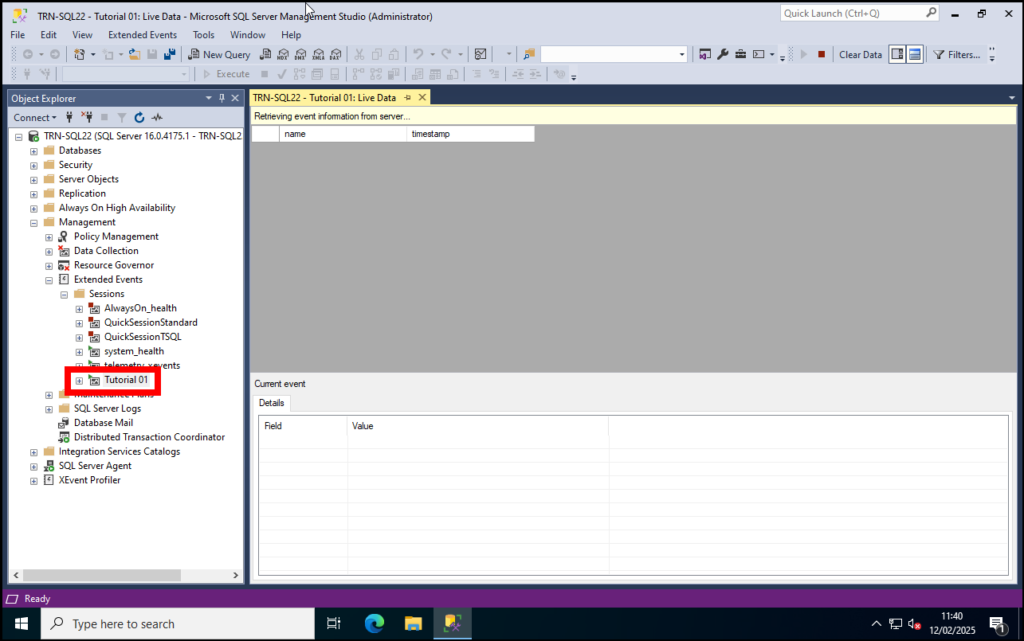
You will then go back into SSMS. Note that the event Tutorial 01 now appears under Instance Name > Management > Extended Events > Sessions in the object explorer and also that a new window for the session events is open.

SSMS: Finished XEvent

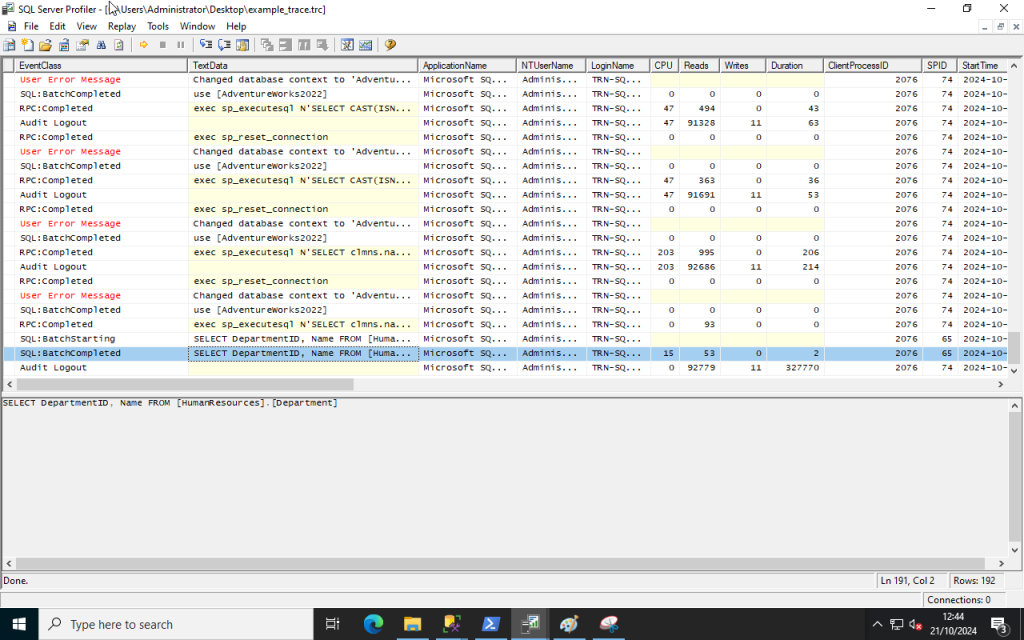
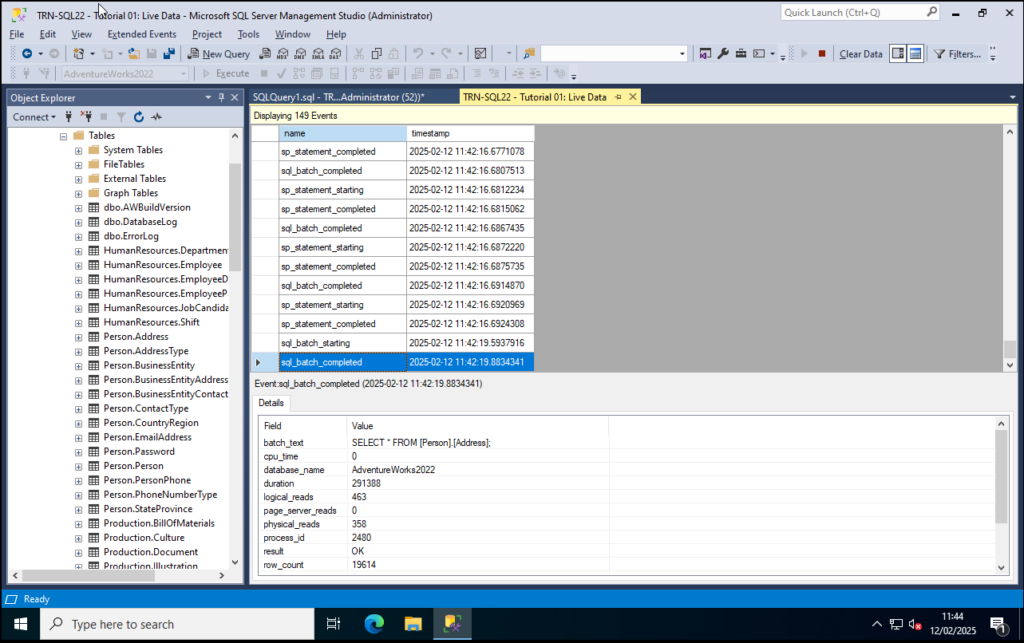
At this point make a simple select query on AdventureWorks2022. I did a lazy one just for demo:

SELECT * FROM [Person].[Address]

You’ll now see events tracking in the session event window:

SSMS: XEvent Query Window

What you’ve just done is a simple session event trace but you can use the steps above to further customise your XEvent to capture the information you require.

Conclusion

We’ve discussed what SQL Server Extended Events are, what the advantages are, and performed a tutorial to build a very basic XEvent on a demo database.

If you organisation needs assistance with SQL Server we are here to help. Digital Incite and Matter Ltd’s consultants are SQL Server trained, certified and experienced with a wide variety of business applications. Get in touch with us today to discuss your requirements.

Something Went Wrong – A Crash Course in Providing a SQL Trace File

We’re all (probably) familiar with the error message Something Went Wrong. You might also receive a long string of numbers, get told to try again later and report the error to an administrator. These kind of messages aren’t really helpful by themselves.

Regardless of where this error is coming from you need to get a better understanding of what’s actually going wrong in order to be able to work out what to do to address it or even to determine if you need to do anything about it.

In SQL Server there are two features which can be used to provide in-depth information: the SQL Server Profiler and Extended Events. As a SQL Server and/or application administrator learning to use these tools is a critical skill in responding to application errors.

Before we go into any further depth it’s necessary to mention that SQL Server Profiler and also the SQL Trace events are marked as deprecated by Microsoft. This means that the features are no longer being developed and will be removed in future versions of SQL Server. That also means you should learn Extended Events for future reference.

From professional experience however many application vendors we work with will still request an SQL Server Trace file (with a .trc extension) so if you need such a trace to add to a support ticket read on.

A Basic SQL Server Trace

Before any trace is started on the SQL Server instance please be aware that this activity can…will place a significant strain on server resources. This could either be the amount of disk space required for the capture or the impact to processing performance. With this in mind you should try to organise an SQL Trace session when you have either exclusive access to the application database or that you know that it will be a quiet time (i.e. after regular office hours). If you are doing this for the first time definitely practice on a test/training environment before working on production.

The settings I’ll go through here are to be considered a basic trace only. If you are being asked to provide a trace file you should always first check with the software author or your DBA asking what events they need to see in the trace. You can then either open their trace template or use the instructions below to select the trace criteria they require.

Please note that the following was performed on SQL Server 2022 with SQL Server Management Studio (SSMS) 20.2. The SQL Server Profiler has very much been the same with all prior versions so don’t expect any major deviations in the instructions.

Step 1: Launch SQL Server Profiler from either the start menu or from SQL Server Management Studio from Tools > SQL Server Profiler. Login with a user that has permissions for ALTER TRACE by clicking Connect.

Step 2: On the first tab – General – we need to setup the basics of the trace:

  • Give the trace a suitable name.
  • For a template use Standard (default) for now.
  • Check Save to File. This will then prompt a save location.
    • Set maximum file size (MB): up this to 100 MB
    • I recommend leaving Enable file rollover checked. This will create multiple trace files as necessary.
SQL Server Profiler - General Tab

Step 3: On the second tab – Events Selection – you will now select the events you want to capture. As we selected the Standard (default) template we have a set of pre-selected events to work with already. I suggest adding a few more in order to get a slightly more useful trace:

  • Click Show all events and Show all columns to see the full list.
  • Select the additional rows using the checkbox to the left of the event:
    • Errors and Warnings
      • User Error Message
    • Stored Procedures
      • SP:Completed
      • SP:Starting
  • Finally uncheck Show all events to only display what events you have selected. Have a little review to make sure the ones suggested have been selected.
SQL Server Profiler - Select Events

Ideally we should filter the trace events to those for the required database(s) only. This can be done by clicking the Column Filters button. On the left scroll to find the DatabaseName filter. Expand the Like operator on the right of the Window then type in the name of the database you want to Trace for. Click OK once you have your databases listed.

SQL Server Profiler - Edit Filter

Step 4: Click run to start the trace. You will see the trace window appear with events being logged. Don’t worry if the events are flying past too quick. The SQL Server Profiler by default will continuously scroll to the bottom.

Notice that there is also now a trace file saved to the path you specified in Step 2.

Step 5: Either get your colleague to replicate the problem in the application or follow their replication steps yourself. In this example I captured doing a simple select statement from AdventureWorks.

SQL Server Profiler - Trace Results

At this point note the two highlighted buttons on the screenshot below. The left “stop” button (Stop Selected Trace) will end the trace and stop SQL Server Profiler from capturing events. The right button (Auto Scroll Window) will stop the window scrolling if you need to quickly study a series of events you have noticed whilst keeping the trace capturing new events.

SQL Server Profiler - Menu Buttons

Once you have finished live analysis make sure to click the Stop Selected Trace button. As mentioned SQL Server Profiler running a trace will have a significant performance impact to the SQL Server instance so don’t leave it!

The aforementioned trace file can now be securely transferred to the software author or you can re-open it later and review it any time you want.

In the SQL Server Profiler window you’ll no doubt see many different events and also captured text in the bottom half of the Profiler window. By studying what the SQL Server engine is doing we can begin the process of troubleshooting problematic or unexpected application behaviour. Whilst the level of information in an SQL Server trace will be comprehensive it’s necessary to take the time to study it properly.

Conclusion

In this blog post we’ve learned to create a basic trace file in SQL Server. Whilst only a basic trace additional events can be captured as well as additional filters specified to help us understand application behaviour when an issue is reported.

If you need further support Digital Incite and Matter can not only help create the requested trace file but we can also work with your software provider to manage the incident case from diagnosis to patch deployment. Please get in touch with us today for further assistance.